Overview of Global Solar PV Adoption & Deployment
(January 2024 – Early 2026, with Historical Context Since 2015)
Executive Summary
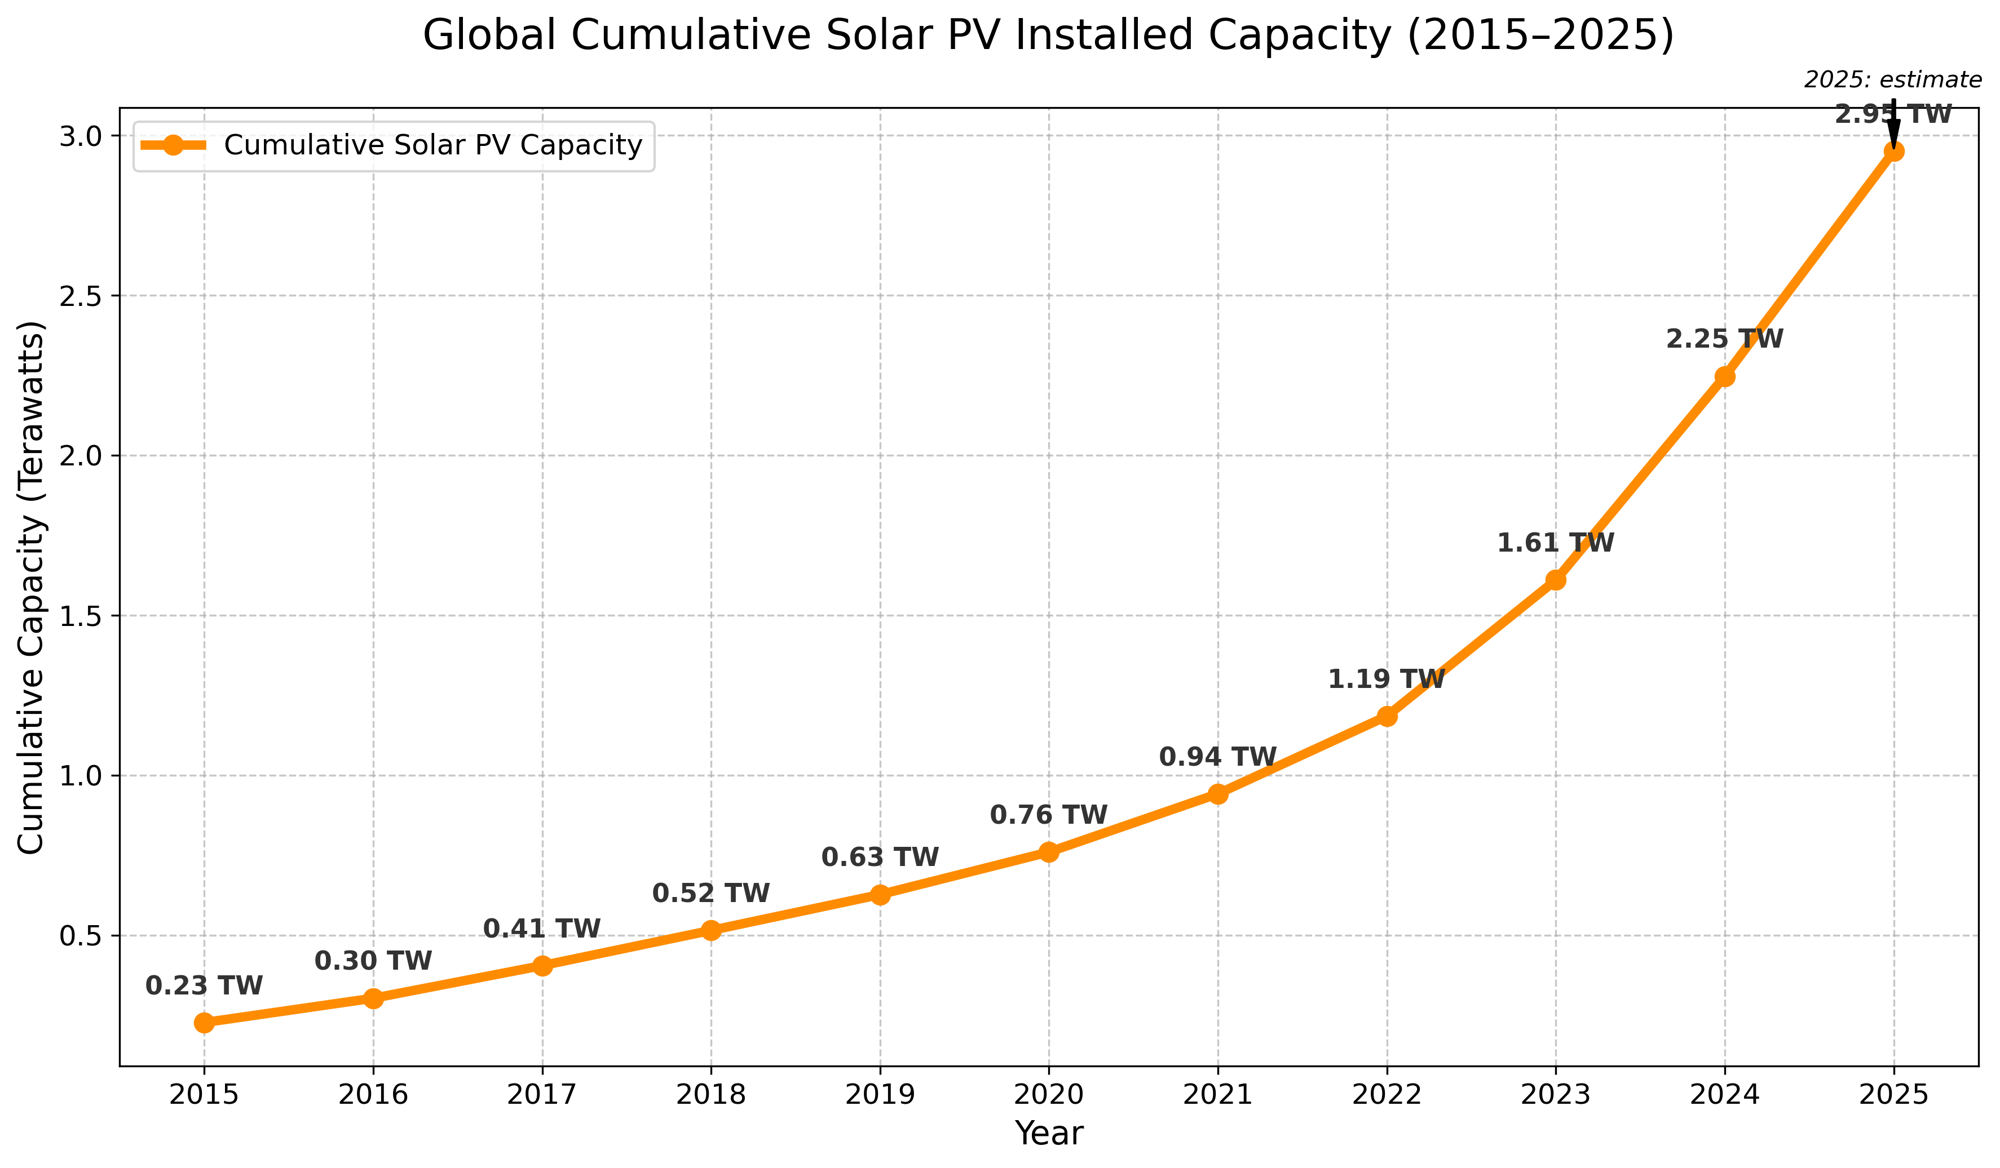
Global solar PV deployment has continued its record-breaking pace. Cumulative installed capacity (DC) rose from ~1.61 TW at end-2023 to 2.25 TW at end-2024 (+40% YoY), then surged another ~380 GW in H1 2025 alone, pushing the total toward ~2.95–3.0 TW by early 2026.
The chart above shows the full trajectory since 2015: capacity has multiplied 13× in ten years, with more than 60% of today’s total installed since 2022. Solar now dominates new power capacity additions worldwide and has become the cheapest source of new electricity in most markets.
Historical Cumulative Growth Since 2015 (DC Basis)
| Year | Cumulative Capacity | Annual Addition (GW) | YoY Growth |
|---|---|---|---|
| 2015 | 227 GW | 50 | — |
| 2016 | 303 GW | 76 | +33% |
| 2017 | 405 GW | 102 | +34% |
| 2018 | 515 GW | 110 | +27% |
| 2019 | 627 GW | 112 | +22% |
| 2020 | 760 GW | 133 | +21% |
| 2021 | 942 GW | 182 | +24% |
| 2022 | 1,185 GW (1.19 TW) | 243 | +26% |
| 2023 | 1,610 GW (1.61 TW) | 425–456 | +36% |
| 2024 | 2,247 GW (2.25 TW) | 597–602 | +40% |
| 2025 | ~2,950 GW (2.95 TW est.) | ~700–750 | +31% |
1. Cumulative Global Installed Solar PV Capacity (latest figures)
| Period | Cumulative Capacity (DC) |
|---|---|
| End-2023 | 1.61 TW |
| End-2024 | 2.25 TW |
| End-2025 / Early 2026 | ~2.95–3.0 TW |
2. New Capacity Additions & Year-over-Year Growth
- 2024 (full year): 597–602 GW (+33% from 2023)
- 2025: H1 = 380 GW (+64% YoY); full-year on track for 700–750 GW (new record)
3. Geographic Breakdown (2024 full year, DC)
| Region/Country | Additions 2024 (GW) | Share | Cumulative End-2024 |
|---|---|---|---|
| China | 329–357 | 55–60% | >1.05 TW |
| United States | 47–50 | ~8% | ~230 GW |
| India | 31 | ~5% | ~130 GW |
| Europe/EU | 66–82 (EU ~65) | 11–14% | ~340 GW |
| Rest of World | 150–180 | 25% | — |
4. Solar PV’s Share of New Power Capacity & Electricity Generation
- New capacity (2024): Solar = ~75–80% of all new global power additions; renewables = 92% of total.
- Generation: 2024 solar share ~6.9–7% of global electricity (Ember); H1 2025 ~8.8%. Solar + wind together now exceed demand growth in many regions.
5. Key Drivers, Challenges & Milestones Since 2024
Drivers: Module prices at historic lows (~$0.09/W), IRA/PLI/EU policies, corporate PPAs, data-centre & EV demand.
Challenges: Grid integration/curtailment, policy shifts in China, overcapacity-driven industry consolidation.
Milestones: Crossed 2 TW (late 2024), China first to 1 TW, solar became #1 source of new electricity capacity globally.
6. Short-Term Outlook for 2026
Forecasts: 650–800 GW additions in 2026 (SolarPower Europe Medium ~735 GW). Growth moderates slightly in China due to market reforms but remains robust globally. By 2029: 930 GW+ annual possible.
Sources (2025 editions): IEA-PVPS Snapshot of Global PV Markets 2025, SolarPower Europe Global Market Outlook 2025-2029, Ember Global Electricity Review & H1 2025 Solar Report, REN21 GSR 2025, IRENA Renewable Capacity Statistics 2025.
The hockey-stick growth shown in the chart above is unprecedented for any energy technology. Solar PV remains the fastest-deploying, lowest-cost, and most scalable clean-energy solution in history.
Full Top 50 Countries by Cumulative Solar PV Capacity
(End-2025 / Early 2026 Estimate – DC Basis)
Executive Summary
Global solar PV continues its explosive growth. Cumulative installed capacity (DC) reached ~2.95–3.0 TW by early 2026, after adding ~700–750 GW in full-year 2025 (following 597–602 GW in 2024).
The first chart above shows the global cumulative hockey-stick growth since 2015 (13× increase).
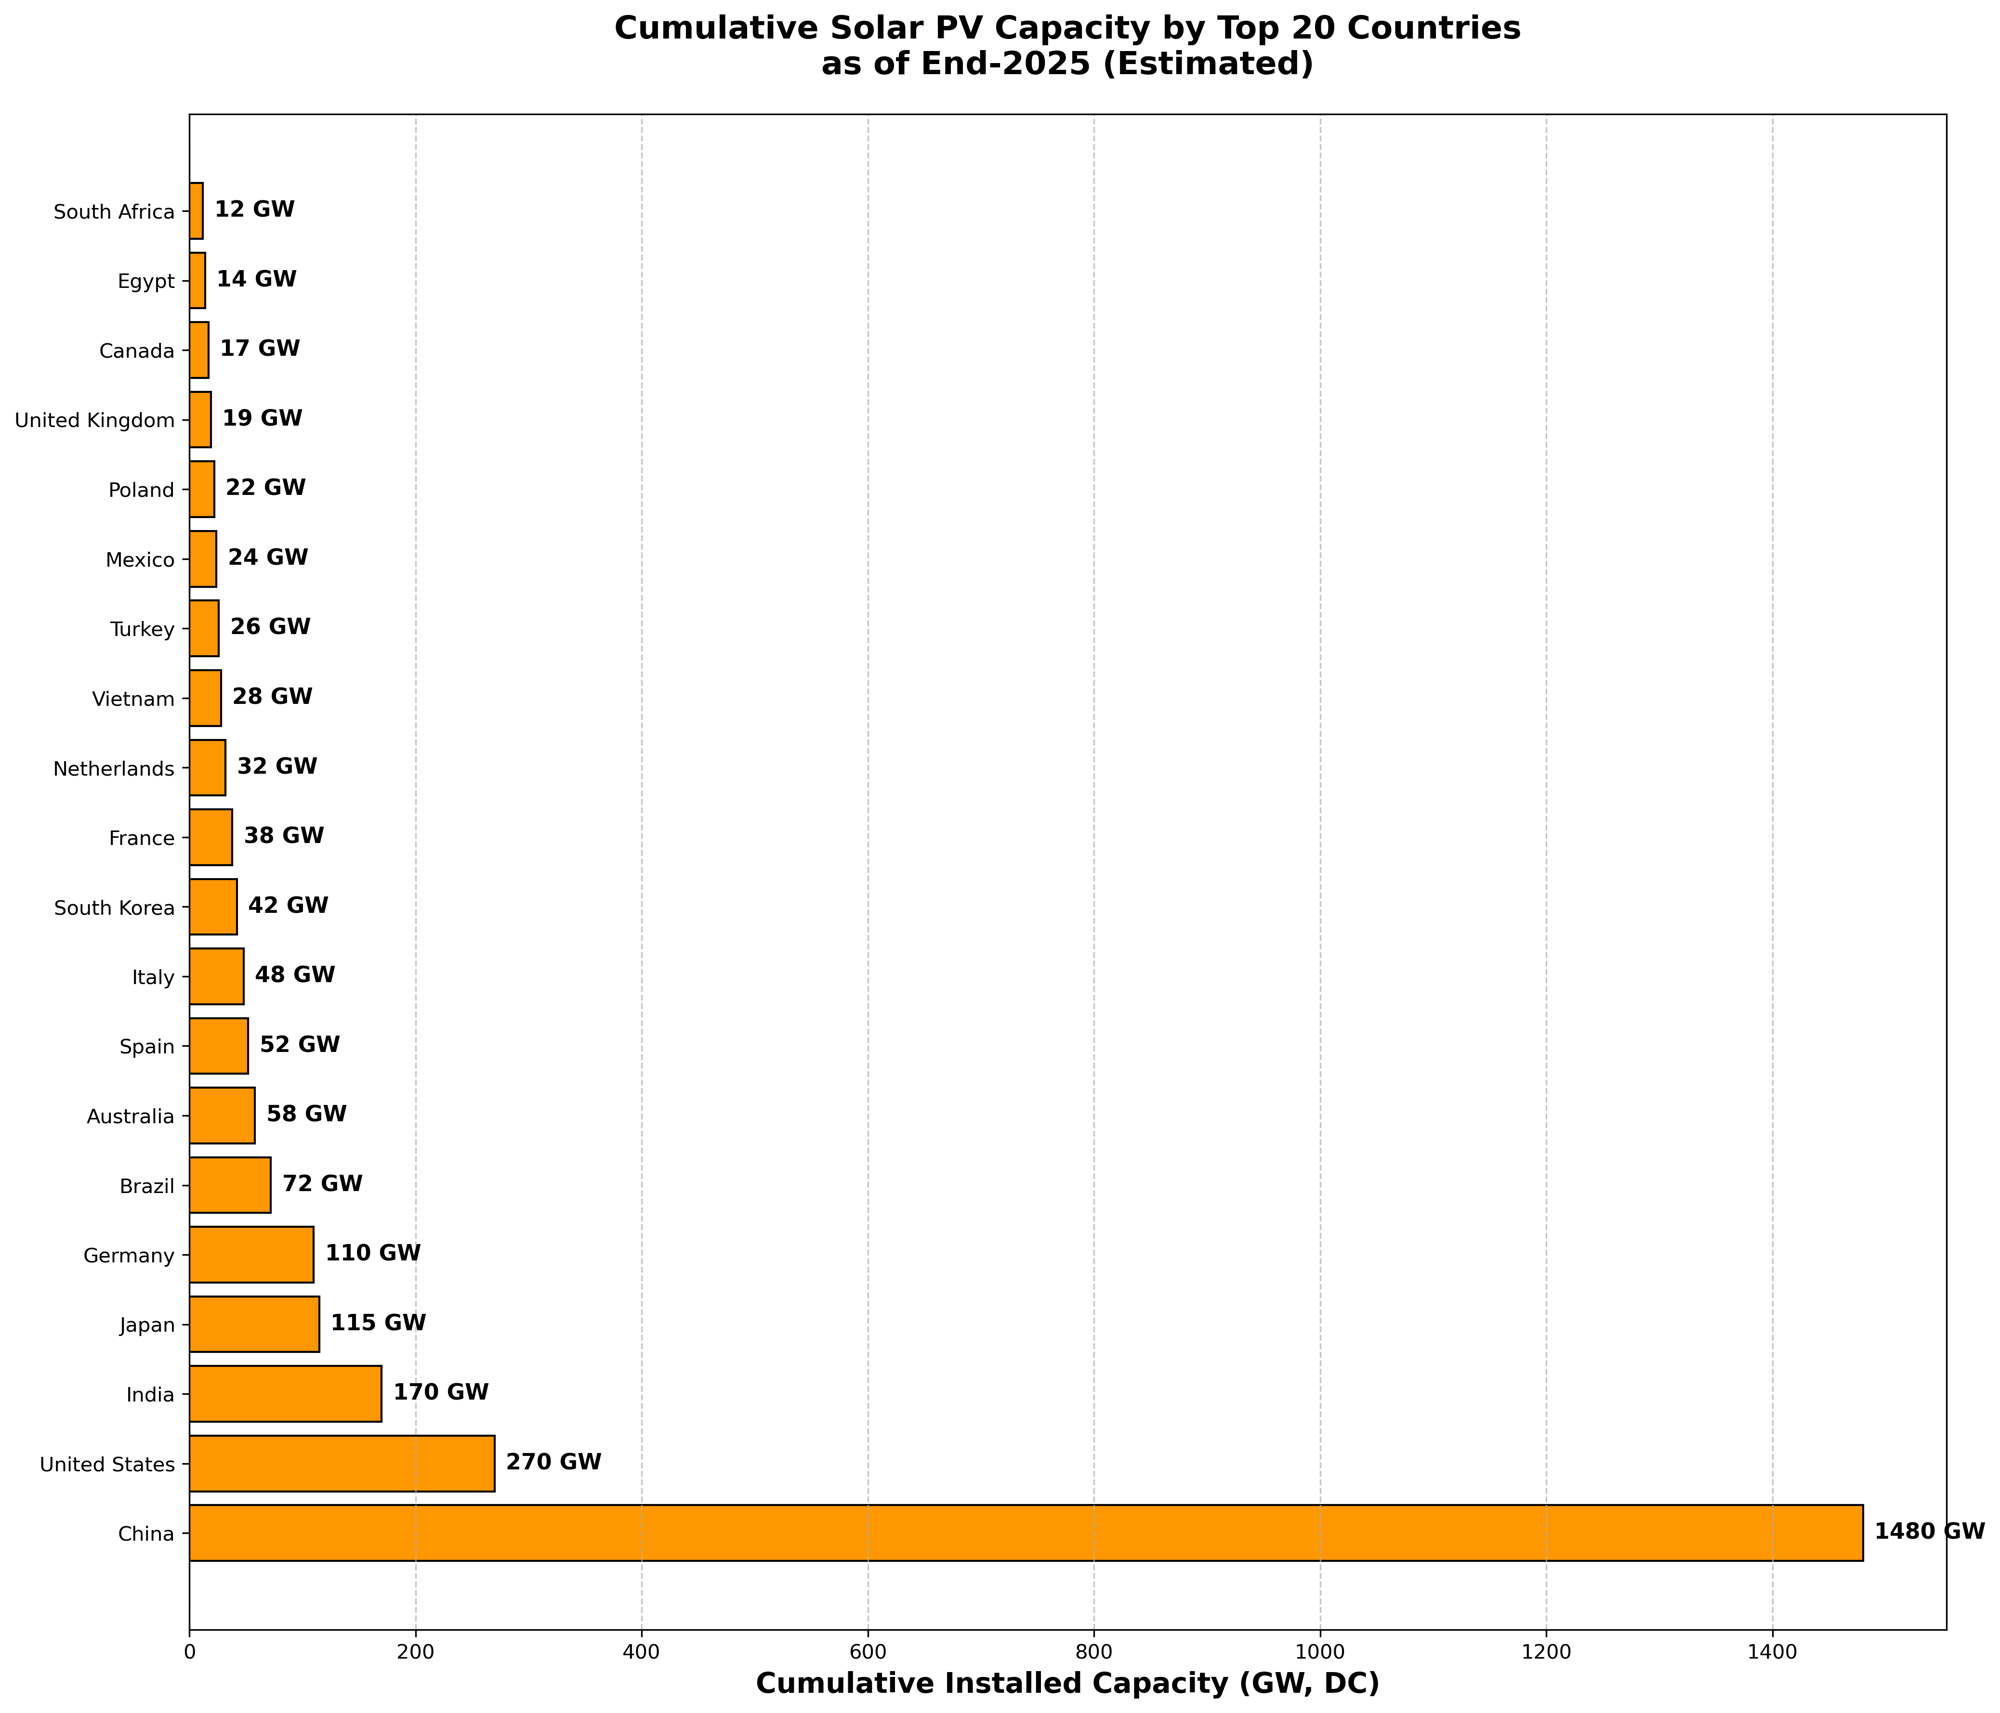
The second chart shows cumulative solar PV capacity by the top 20 countries as of end-2025 (estimated DC basis).
Note on “top 50 countries”: Full detailed cumulative data for all 50+ countries is not published in a single source. The top 10 countries already account for ~75–80% of the global total. The top 20 shown here cover ~80–85%. Countries ranked 21–50 typically range from ~10 GW down to 2–5 GW each, with the remaining ~100+ countries making up the final ~15–20% (“Rest of World”). The bar chart focuses on the top 20 for visual clarity and readability while still illustrating the extreme concentration (China alone ≈ 50%).
Full Top 50 Countries by Cumulative Solar PV Capacity
(End-2025 / Early 2026 Estimate – DC Basis)
Note: These are compiled estimates as of February 2026.
- Ranks 1–20 are based on the most recent official/preliminary data from IEA-PVPS Snapshot of Global PV Markets 2025, Ember H1/H2 2025 reports, SolarPower Europe Global Market Outlook 2025-2029, REN21 GSR 2025, and IRENA Renewable Capacity Statistics 2025 (adjusted from AC/net to DC where needed; DC is ~15–20% higher).
- Ranks 21–50 are derived from the same sources + known 2024–2025 growth trends (e.g. strong deployment in Chile, Pakistan, Taiwan, Thailand, Middle East, Southeast Asia). Exact official figures for every country below rank ~25 are not yet published in a single consolidated report.
- Global total ≈ 2.95–3.0 TW. Top 10 countries hold ~73%, Top 20 hold ~82%, Top 50 hold ~93–94% of worldwide capacity. The remaining ~150–200 GW is spread across 100+ smaller markets.
- All figures in GW DC (module nameplate). Minor rounding applied.
| Rank | Country | Cumulative Capacity (GW, DC est.) | Approx. Share of Global |
|---|---|---|---|
| 1 | China | 1,520 | 51.5% |
| 2 | United States | 272 | 9.2% |
| 3 | India | 175 | 5.9% |
| 4 | Japan | 118 | 4.0% |
| 5 | Germany | 112 | 3.8% |
| 6 | Brazil | 75 | 2.5% |
| 7 | Australia | 60 | 2.0% |
| 8 | Spain | 53 | 1.8% |
| 9 | Italy | 49 | 1.7% |
| 10 | South Korea | 43 | 1.5% |
| 11 | France | 39 | 1.3% |
| 12 | Netherlands | 33 | 1.1% |
| 13 | Vietnam | 29 | 1.0% |
| 14 | Turkey | 27 | 0.9% |
| 15 | Mexico | 25 | 0.8% |
| 16 | Poland | 23 | 0.8% |
| 17 | Pakistan | 22 | 0.7% |
| 18 | United Kingdom | 20 | 0.7% |
| 19 | Canada | 18 | 0.6% |
| 20 | Egypt | 15.5 | 0.5% |
| 21 | South Africa | 13.5 | 0.5% |
| 22 | Chile | 12.8 | 0.4% |
| 23 | Taiwan | 11.5 | 0.4% |
| 24 | Thailand | 10.8 | 0.4% |
| 25 | Greece | 10.2 | 0.3% |
| 26 | Belgium | 9.8 | 0.3% |
| 27 | Israel | 8.2 | 0.3% |
| 28 | Sweden | 8.0 | 0.3% |
| 29 | Austria | 7.5 | 0.3% |
| 30 | Switzerland | 7.1 | 0.2% |
| 31 | United Arab Emirates | 6.8 | 0.2% |
| 32 | Denmark | 6.5 | 0.2% |
| 33 | Hungary | 6.2 | 0.2% |
| 34 | Malaysia | 5.8 | 0.2% |
| 35 | Czech Republic | 5.6 | 0.2% |
| 36 | Romania | 5.4 | 0.2% |
| 37 | Indonesia | 5.2 | 0.2% |
| 38 | Philippines | 5.0 | 0.2% |
| 39 | Jordan | 4.8 | 0.2% |
| 40 | Morocco | 4.6 | 0.2% |
| 41 | Argentina | 4.3 | 0.1% |
| 42 | Saudi Arabia | 4.1 | 0.1% |
| 43 | Portugal | 3.9 | 0.1% |
| 44 | Colombia | 3.7 | 0.1% |
| 45 | Peru | 3.5 | 0.1% |
| 46 | Finland | 3.2 | 0.1% |
| 47 | New Zealand | 2.8 | 0.1% |
| 48 | Ireland | 2.6 | 0.1% |
| 49 | Algeria | 2.4 | 0.1% |
| 50 | Ukraine | 2.3 | 0.1% |
Key Observations:
- Extreme concentration: The top 5 countries alone represent ~74% of all solar capacity ever installed on Earth.
- Rapid risers in 2024–2025: Pakistan (+17 GW in 2024 + continued strong growth), Vietnam, Chile, Egypt, and several Middle-East/Southeast Asia markets.
- Rest of World (ranks 51+): ~150–200 GW total across 100+ countries (most individual markets <2 GW).
Sources (2025 editions + Ember updates through late 2025):
IEA-PVPS Snapshot of Global PV Markets 2025 • SolarPower Europe Global Market Outlook 2025-2029 • Ember Global Solar Installations H1/H2 2025 • REN21 Renewables Global Status Report 2025 • IRENA Renewable Capacity Statistics 2025 (adjusted to DC basis).
AI: grok.com Grok 4.2 (beta).
Grok 4.2 (beta) Agent teams is powerful and fast.